This morning I learned the Fisheries Committee received the list of the scientific advice back in December 2019.
From this, you can start to work out how often fisheries ministers and the Commission followed the advice of scientists.
Source EP link and Council text
| Name | Area | ICES Advice
Catches corresp. to advice (tonnes) |
Commission Proposal | Council Agreement 2020 | Variation from Scientific
Advice % |
| Eastern Baltic cod
|
0 | 2 000 (by-catch only) | 2 000
(by-catch only) |
infinity | |
| Western Baltic cod
|
3065 | 3 065 | 3 806 | 23 | |
| North Sea cod (North Sea*, English channel, Skagerrat) | 13,686 | 17,679 | 17,679 | 29 | |
| Common Sole | 3a | < 539 | 533 | 533 | 0 |
| Common Sole | 7a | 561 | 457 | 457 | 18 (-) |
| Common Sole | 7e | < 1 488 | 1 478 | 1478 | 0 |
| Common Sole | 7f & g | < 1488 | 1 652 | 1652 | 0 |
| Haddock | 7b etc | <16 671 | 10 859 | 10 859 | 0 |
| Herring | 7a | 0 | 8 064 | 8 064 | infinity |
| Plaice | 7fg | <2 295 | 2003 | 2003 | 0 |
| Great silver smelt | Union | <10 270 | 1 324 | 1234 | 0 |
| Ling | 3a etc | <18 516 | 24 601 | 24803 | 33 |
| Norway Lobster | 8c | 0 | 2.7 | 2.7 | infinity |
| Norway Lobster | 3a | <19 904 | 13 733 | 13 733 | 0 |
| Tusk | 1,2 14 | <11 077 | 21 | 21 | 0 |
The comparison is not straightforward. In a few cases, the area and stock for the advice do not correspond with the final TAC agreed to.
The record of following the advice is varied. Often, the advice is followed, but in enough cases to be noticed, the gaps are several hundred to thousand % difference. In those cases, I just put affinity.
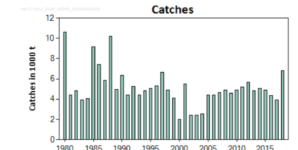
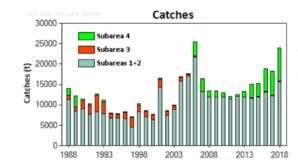
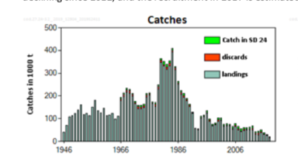
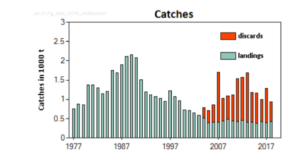
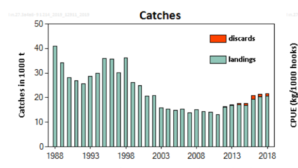
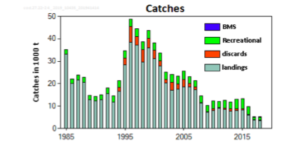
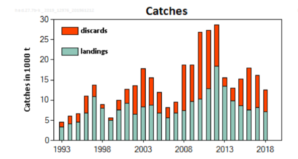
What’s interesting is the ICES catch data.
Where stocks are in a good place, scientific advice is followed. When it is in a poor or dire place, – and the catches are depleted from recent historical level – officials and ministers are more comfortable to second guess nature.
If healthy stocks are re-built following advice and poor stocks don’t, maybe someone will find out that there is obvious to re-build the stocks.